The vector data model uses points and their x-, y- coordinates to construct spatial fetures of points, lines and areas. Vector based features are treated as discrete objects over the space. Vector lines are often referred to as arcs and consist of string of vertices terminated by a node. Anode is defined as a vertex that starts or ends an arc segment.
Point features are defined by one coordinate pair, a vertex. Polygonal features are defined by a set f closed coordinate pairs. In vector representation, the vertices for each feature is important, as well as the connectivity between features. E.g. the sharing of common vertices where features connect.
VECTOR DATA STRUCTURE
The vector representation of an object is an attempt to represents the object as exactly as possible. The coordinate space is assumed to be continuous, not quantized as with the raster space, allowing all positions, lengths and dimensions to be defined precisely a range of vector structures use geographical information system of points, lines and areas.
- Points Entities: - Points defines discrete location of geographic feature too small to be depicted as lines or areas , such as well location, telephone pole etc. Point can also represent location that have no area such mountain peak. Point entities positioned by a single XY coordinate pair.

- Line Entities: - Line entities can be defined as all features built up of straight-line segments made up of two or more coordinates. The simplest line required the storage of a begin point and an end point (two XY coordinate points) plus a possible records indicating the display symbol to be used.

- Area Entities: - Areas of polygons can be represented in various ways in a vector database. The simplest way to represents a polygon is an extensions of the simple chain, i.e. to represents each polygon as a set of XY coordinates on the boundary. Areas are closed figures that represent shape and location of homogeneous feature such as states, soil types, land use zones.

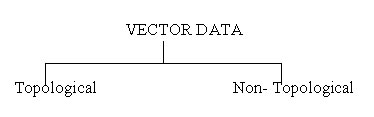
Vector data are categorized as topological and non-topological. Topology, as used in GIS, expresses explicitly the spatial relationships between features, such as two line meeting perfectly at a point and a directed line having an explicit left and right side. Topology is useful for detecting digitizing errors in digital maps and is necessary for some map overlay operations and network analysis. Non-topological data display faster and more importantly they can be used directly in different GIS software packages. In ESRI softwares , topological based digital maps termed as coverage and non-topological based digital maps are termed as shapefiles. GIS users should know whether their data are topological or not.
Topological vector data can be further categorized into simple and higher data.
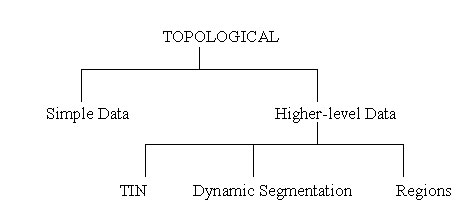
Simple vector data can be consisting of points, lines and polygons. Higher level data are built upon simple points, line and polygons. The triangulated irregular network (TIN) approximates the terrain with a set of non-overlapping triangles. Each triangle in a TIN consists of points and edges (lines) that connect these points to form triangles. A region is a collection of polygons, which may or may not be connected, and region may overlap with one another or form a nested set. Dynamic segmentation is a data model that is built upon lines of a network and allows the use of real-world coordinates with linear measures such as mileposts.+
ADVANTAGES
- Good representation of phenomenological data structure.
- Good compact data structure.
- Topology can be completely described with network linkages.
- Accurate graphics.
- Retrieval, updating and generalization of graphics and attributes are possible.
DISADVANTAGES
- Complex data structures.
- Combination of several vector polygon maps or polygon and raster maps through overlay creates difficulties.
- Simulation is difficult because each unit has a different topological form.
- Display and plotting can be expensive, particularly foe high quality, color and crosshatching.
- Technology is expensive, particularly for the more sophisticated software and hardware.
- Spatial analysis and filtering within polygons are impossible.
|
|
|
|
Last Updated on 28 September 2012