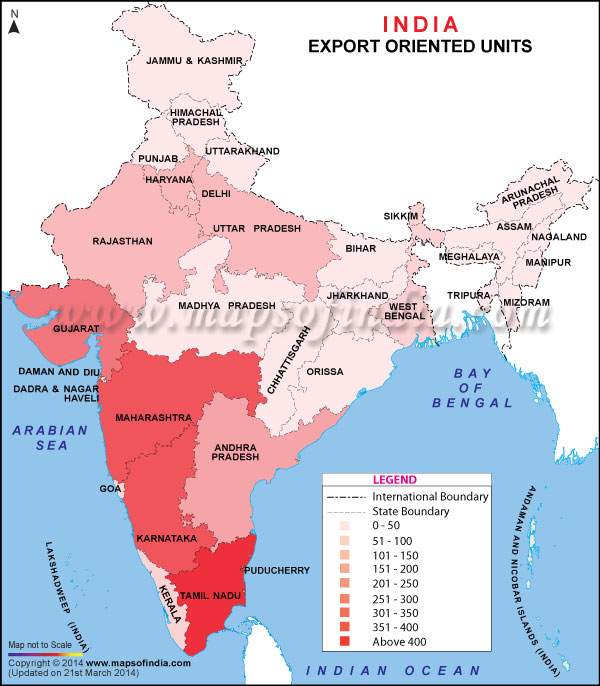
Export Oriented Units in India |
|
|||||||||

|
|||||||||
|
*Concentration of Export Oriented Unites in India is shown in India Map. States with highest concentration of Export orinented units are located here.
Disclaimer: All efforts have been made to make this image accurate. However Mapping Digiworld Pvt Ltd and its directors do not own any responsibility for the correctness or authenticity of the same.
Disclaimer: All efforts have been made to make this image accurate. However Mapping Digiworld Pvt Ltd and its directors do not own any responsibility for the correctness or authenticity of the same.
Last Updated on : November 13, 2025
Export Oriented Units in India |
S.No. |
Zone |
States/UTs |
Functional EOUs as on 31.3.2008 |
Zone total Functional EOUs |
Export(Prov.)*In Rs Crores |
Export(Prov)*In US $ Million |
ZonewiseTotal ExportIn Rs. Cr. |
ZonewiseTotal ExportUS$ Million |
| 1 | Chhattisgarh | 3 | 15.39 | 3.82 | ||||
| 2 | Falta SEZ | West Bengal | 80 | 111 | 1347.95 | 334.81 | 2104.2 | 522.64 |
| 3 | Bihar | 0 | 0 | 0 | 0 | 0 | ||
| 4 | Jharkhand | 6 | 49.11 | 12.2 | ||||
| 5 | Orissa | 23 | 705.75 | 175.3 | ||||
| 6 | Assam | 0 | 0 | 0 | ||||
| 7 | Tripura | 0 | 0 | 0 | ||||
| 8 | Mizoram | 1 | 0 | 0 | ||||
| 9 | Manipur | 0 | 0 | 0 | ||||
| 10 | Meghalaya | 1 | 1.39 | 0.35 | ||||
| 11 | Arunachal Pradesh | 0 | 0 | 0 | ||||
| 12 | Sikkim | 0 | 0 | 0 | ||||
| 13 | Kandla SEZ | Gujarat | 289 | 289 | 83836.48 | 20823.4 | 83836.48 | 20823.4 |
| 14 | Cochin SEZ | Kerala | 70 | 468 | 1065 | 264.53 | 19222 | 4774.38 |
| 15 | Karanataka | 398 | 18157 | 4509.86 | ||||
| 16 | Madras SEZ | Tamil Nadu | 435 | 466 | 12969.86 | 3221.47 | 13543.14 | 3363.86 |
| 17 | Pondichery | 4 | 0.32 | 0.08 | ||||
| 18 | A & N Island | 4 | 0.32 | 0.08 | ||||
| 19 | SEEPZ-SEZ | Maharashtra | 374 | 446 | 6577.48 | 1633.72 | 9310.06 | 2312.44 |
| 20 | Goa | 52 | 2349.79 | 583.64 | ||||
| 21 | Daman and Diu | |||||||
| 22 | Dadra&Nagar Haveli | 20 | 382.79 | 95.08 | ||||
| 23 | Noida SEZ | Delhi | 61 | 452 | 881.59 | 218.97 | 8768.4 | 2177.91 |
| 24 | Haryana | 116 | 1588 | 394.43 | ||||
| 25 | Uttar Pradesh | 111 | 4197.59 | 1042.6 | ||||
| 26 | Punjab | 27 | 579.05 | 143.83 | ||||
| 27 | Rajasthan | 121 | 1417 | 351.96 | ||||
| 28 | Himachal Pradesh | 6 | 45.61 | 11.33 | ||||
| 29 | Jammu & Kashmir | 3 | 29.98 | 7.45 | ||||
| 30 | Chandigarh | 3 | 7.76 | 1.93 | ||||
| 31 | Uttrakhand | 4 | 21.82 | 5.42 | ||||
| 32 | Indore SEZ | Madhya Pradesh | 19 | 19 | 1011.38 | 251.21 | 1011.38 | 251.21 |
| Export Processing Zones in India |
|
|