A map is a visual representation of an entire area or a part of an area, typically represented on a flat surface. The work of a map is to illustrate specific and detailed features of a particular area, most frequently used to illustrate geography. There are many kinds of maps; static, two-dimensional, three-dimensional, dynamic and even interactive. Maps attempt to represent various things, like political boundaries, physical features, roads, topography, population, climates, natural resources and economic activities.
History and Evolution of Maps
:Maps have been around for 8000 years or so. Cartography was significantly advanced in ancient Greece. The notion of a spherical Earth was recognized among Greek philosophers by the time of Aristotle and has been acknowledged by all geographers ever since.
In the Medieval period, European maps were mostly based by religious views. Viking explored the North Atlantic while map-making developed more realistic and practical lines in the Mediterranean region. All maps were drawn by hand, which made the circulation of maps limited.
During the 17th to the 19th century, Maps became more and more accurate and factual with the use of scientific techniques. Various countries adopted national mapping programs. Following World War I, the widespread use of aerial photography helped a lot in map-making process. The combination of ground observations and remote sensing is the base of modern cartography.
Cartography has constantly evolved in order to meet the demands of new generations of map makers' users. The oldest identified maps are from around 2300 B.C. which are preserved on Babylonian clay tablets. The first maps were manually made with brushes on parchments and varied in quality and limited in circulation. The invention of the compass, printing press, telescope, etc allowed the formation of more accurate maps and the ability to make accurate reproductions.
Advances in technologies, has made possible the creation of maps with fine details, no distortion in shape and less resistant to wear and tear. This also removed the need for engraving which reduced the time to create and reproduce maps. Advances in electronic technology in the late 20th century, led to a new revolution in cartography. Computer hardware devices such as computer screens, printers and scanners along with image processing, visualization, spatial analysis and database software, have extended the ability to produce maps that show different features.
Cartography
:The study and practice of the many facets of maps and map making is called Cartography. It can be described as the art and science of map making. Apart from designing and producing maps, cartography includes studying the history of maps, printing, distributing and selling them, collecting, conserving and curating them in map libraries. The variety of maps available goes well beyond road and topographic maps, it incorporates military charts, statistical , geological, tourist and travel maps, weather and climate maps, general and specialist atlases, cartograms, transport network diagrams etc Map for computer and internet use have recently grown in importance and Geographical Information Systems (GIS) have a digital map at their core. Good Cartography is important because a well designed map communicates better than a badly designed one. The quality of each map varies widely.
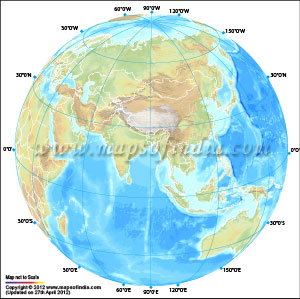
Map and Globe
:The word "Globe" is taken up from the Latin word "Globus" which means a round mass or sphere. A globe is a three dimensional representation of the earth that does not distort the shape or size of earth's geographical features. Sometimes a globe shows the topography elevations otherwise they are plain round, some globes include imprinted lines with parallels and meridians for finding the coordinates of a particular place. Globes offer the most precise view of Earth at present.
Advantages of maps over globes:
- Maps are more compact
- Easy to store
- Can hold different range of scales
- Easily viewed on different sized screens
- Can show larger portions of an area at once
- Cheaper to produce and transport.
Uses of Map
:A map is useful for both a layman and an intelligent person, as maps contain loads of information. It is up to an individual how he makes use of it. Maps are generally used for:
- Analysis
- Confirmation
- Communication
- Decoration
- Collection
- Investment
- Exploration
- Hypothesis Stimulation
- Navigation
- Control & Planning
- Map Reading
- Storage of Information
- Historical perspective
Scale of Map
:As a map has to represent a portion of earth's surface accurately, each map has to have a "scale" which indicates the relation between the distance on the map and the actual distance on the land. The map scale is typically shown in the legend box of a map, along with other symbols that provides useful information about the map.
A ratio or representative fraction specifies how many units on land is equal tone unit on the map. For example, a map showing a scale of 1/ 100000 or 1:100000, tells us that one centimeter on the map is equal to 100000 centimeters i.e. 1 kilometer on the Land. The ratio is always mentioned in the map, such as "one centimeter equals one kilometer" or "one inch equals ten miles".
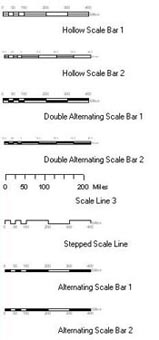
A graphic scale also known as the bar scale is a line that specifies the distance in kilometers or miles as they show on a map; even as the map is enlarged or reduced in size the line has an advantage of remaining accurate. Maps can be recognized as large scale or small scale maps. A large scale map shows much more detail than a small scale map.
Map Projection and different types of projections
The method of representing the surface of a globe or any three dimensional body on a flat surface is known as projection. Map projection is important for creating maps. The basic problem in any map projection is that there is always some distortion. It could be in distance, shape, area or direction. Map projections can be constructing to conserve one or more of these properties that are area, direction, shape, scale, distance and bearing, but not all of them together. Every projection gives and takes basic metric properties in dissimilar ways.
Projections of maps are classified into two types:
1) Projections by surface:
- Cylindrical
- Pseudo cylindrical
- Hybrid
- Conical
- Pseudo conical
- Azimuthal
- Conformal
- Equal-area
- Equidistant
- Gnomonic
- Retro Azimuthal
- Compromise projections
How Maps are made
:Though maps may vary in type and appearance, the method of creating them is similar. Much thought goes into the planning, designing and production of good maps.
Defining the product:
The reason for making the map, the target audience, the budget and the available technology helps to determine the maps size, layout and appearance.
Design:
The design process is critical to produce a good map. Sketches, rough layouts and alternatives lead to final design and help to specify that the map is consistent and information is clear.
Data Retrieval:
Some maps use new data from field surveys or aerial photographs, but most of them are derived from existing maps. The required features are selected, edited and additional information is incorporated from other sources.
Map Production:
A map can be a piece of artwork, created manually or digitally. It depends on the origin of the information, a map can be a carefully hand drawn compilation which is scanned and digitalized or it can be made up from elements selected from existing datasets. Whatever the style may be, the colors, design specs, line weights, symbol sizes, type styles are all applied as the map is made.
Checking and Proofing:
Maps are checked for errors and laser proofs are produced if the map is to be printed. Errors are corrected and new proofs are made for final approval.
Final Output:
Maps for screen use remain in digital form, where as paper maps are usually printed in four process colors (CMYK or Cyan, Magenta, Yellow, Black) which are combined to produce full range of colors. 'Spot' colors are occasionally introduced to match corporate color schemes and some maps are designed in only one or two colors.
How to understand or read a map
:The symbols, directions, lines and legend all require some understanding before you can start reading a map effectively. A wide variety of maps are available for a different uses. For example road maps, tourist maps, local maps etc. so decide your purpose of use and pick the right map.
Compass reading -
Most maps have north drawn at the top, therefore west is left, and east is right and south is base of the map. This helps us to rotate the map until it's facing the actual directions wherever you're positioned. The compass may be depicted as a compass rose or a cross-like shape. If nothing is mentioned, the top of the map is presumed as north.
Scale of the map -
Maps are made in scales that vary in size from map to map. You can find the scale in the form of a ratio, placed on the side or bottom of the map. It will show something like 1:100,000, which indicates that 1 unit on the map is the equal to 100,000 units in real life.
Latitude and Longitude -
The latitude is the distance in degrees from north or south of the equator. The longitude is the distance in degrees east or west of the Greenwich Meridian Line. Each degree is separated into 60 minutes, each minute representing a nautical mile (or 1.15 land miles/1.85km). Therefore one degree is the equal to 60 nautical miles or 69 land miles/111km. The latitude and longitude is represented by the numbers on the side and top and bottom of the map. Where these two cross at your location, that site is your actual position. These are often used when there are no landmarks or roads to find out a location.
Contour lines -
These lines represent how high or flat the land is on the map. Each line signifies an average height above sea level. When these lines are close together, that means the gradient is steep. When the lines are further apart, the gradient is flatter.
Legend or Key -
Maps denote particular symbols for particular items of interest.
Most maps have them on the map itself and since the source of the map doesn't essentially conform to any standard, one should always look for the legend or key first.
General legend or key that maps follow:
- Lines in different sizes, colors, unbroken or broken depict roads, lanes and freeways.
- Mountains are shown as white or brown.
- Rivers, lakes, oceans and other water bodies are shown in blue.
- Forests, parks or large area of greenery and land areas like parks, golf courses, etc are shown in green.
- Buildings are shown in gray or black.
Tools to Create a Map
:There are lots of tools for map-making in the market, to keep it simple we have listed the most popular ones.
ArcGIS -
ArcGIS is used for creating maps, compiling data and analyzing mapped information, sharing geographic information, using maps and information in a variety of applications and organizing the information database.
Adobe Illustrator -
Adobe Illustrator is graphics design software, developed by Adobe Systems. It is one of the premier vector-drawing software for creating graphics. It is available on both Windows and Mac Operating Systems.
MaPublisher -
MaPublisher is a plug-in for Adobe Illustrator that connects the gap between Geographic Information Systems and high end graphics for high quality creation, printing and publishing of maps.
MapInfo -
MapInfo is a powerful mapping tool, now called Pitney Bowes Software it is designed to easily picture the associations between the data and geography.
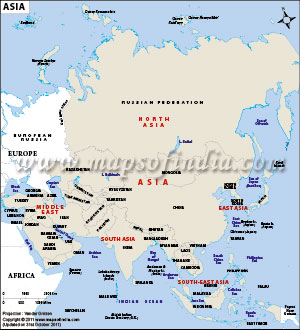
Sample Maps
 |  |  |
 |  |  |
Last Updated on : February 15, 2019