With the help of a neat and labeled diagram, explain the three stages of the Demographic Transition Theory
Komal Kohli February 14, 2023
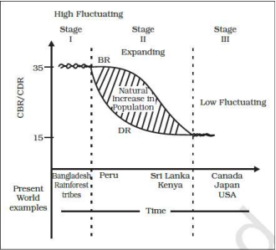
Question 7:With the help of a neat and labeled diagram, explain the three stages of the Demographic Transition Theory.
The correct answer is -The three stages of the Demographic Transition Theory with
diagram:
The above diagram explains the three-staged model of
Demographic Transition Theory:
● The first stage has high fertility and high mortality
because people reproduce more to compensate for the
deaths due to epidemics and variable food supply. The
population growth is slow and most of the people are
engaged in agriculture where large families are an asset.
Life expectancy is low, people are mostly illiterate and
have low levels of technology. Two hundred years ago all
the countries of the world were in this stage.
● Fertility remains high in the beginning of the second stage
but it declines with time. This is accompanied by a
reduced mortality rate. Improvements in sanitation and
health conditions lead to decline in mortality. Because of
this gap the net addition to population is high.
● In the last stage, both fertility and mortality decline
considerably. The population is either stable or grows
slowly. The population becomes urbanised, literate and
has high technical knowhow and deliberately controls the
family size. This shows that human beings are extremely
flexible and are able to adjust their fertility..