Narendra Modi-led NDA has been in power for two years now and so it is important to take a look at his government’s performance over the last two fiscal years. Modi took office at a difficult period when the global macro-economic outlook was yet to recover. Under the circumstances, keeping a tight leash on inflation while ensuring fiscal consolidation remained a top priority for his government. The government’s moves on ease of doing business in India and initiatives like Make in India, Digital India and 100 Smart cities project attracted international attention and investment. Although agricultural growth has not grown as expected, social sector spending has increased with the government launching initiatives like the Jan Dhan Yojana, Jan Aadhaar and a host of health and insurance schemes for the weaker sections. However, the Modi government has yet to deliver on several key areas like much needed reforms in judiciary, police, labour laws, corporate laws, public sector disinvestment etc. Important legislations like the GST Bill are among several pending Bills that are yet to be passed as the government has not been able to bring the opposition on board. Snapshot of performance comparison of the first two fiscal years – FY14-15 and FY15-16 – under PM Modi
Parameters |
Year 2013-14 |
Year 2014-15 |
Year 2015-16 |
| GDP Growth(at 2011-12 prices) | 6.90% | 7.20% | 7.6% (AE) |
| External Debt | $440.6 billion | $475.8 billion | $480.2 billion (as on end Dec’15) |
| Exports | $312.35 billion | $310.33 billion | $261.13 billion |
| Imports | $450.94 billion | $448.03 billion | $379.59 billion |
| Trade Balance | negative $138.59 billion | negative $137.69 billion | negative $118.45 billion |
| Forex Reserves | $ 298.64 billion | $341.6 billion | $349.6 billion (till Jan 2016) |
| BSE SENSEX | 22467.21(As on 31 Mar 2014) | 2795749.00% | 25341.86 |
| Industrial Growth | 4.50% | 2.80% | 3.1%(April-Dec) |
| Inflation | CPI : 9.5%, WPI : 5.9% | CPI : 5.9%, WPI : 2.0% | CPI : 4.9%, WPI : -2.8% |
| Service Sector Growth | 6.80% | 10.30% | 9.2%(AE) |
| Foodgrain Production | 252.68 million tonnes | 252 million tonnes | 253.2 million tonnes (AE) |
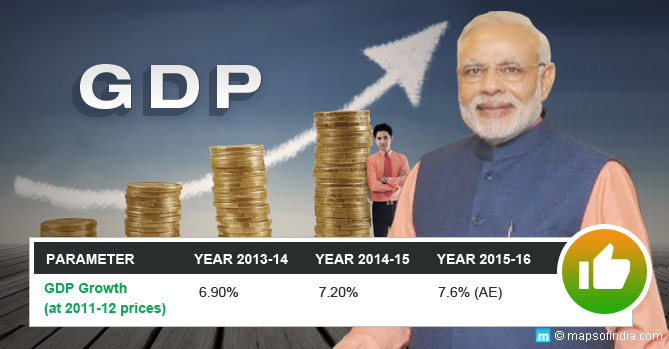
GDP Growth (at 2011-12 prices)
Parameter |
Year 2013-14 |
Year 2014-15 |
Year 2015-16 |
| GDP Growth (at 2011-12 prices) | 6.90% | 7.20% | 7.6% (AE) |
Poor monsoons in consecutive years have contributed to the subdued growth rate in 2014-15 and 2015-16. However, with signs of above average monsoons and if the GST Bill gets passed this year, the government is hopeful of improving the 7.6% estimate for 2015-16 in the next fiscal. The extent of growth will largely depend on the extent of pending Bills passed in Parliament. International investor outlook on India remains positive for 2016-17. External Debt
Parameter |
Year 2013-14 |
Year 2014-15 |
Year 2015-16 |
| External Debt | $440.6 billion | $475.8 billion | $480.2 billion (as on end Dec’15) |
The external debt marks a 1.0% increase over the debt at the end of March’15. The rise was mainly on account of long-term external debt, which included commercial borrowings (38.3% of total external debt), and NRI deposits (25.5% of total external debt). Exports & Imports
Parameter |
Year 2013-14 |
Year 2014-15 |
Year 2015-16 |
| Exports | $312.35 billion | $310.33 billion | $261.13 billion |
| Imports | $450.94 billion | $448.03 billion | $379.59 billion |
Just as exports declined around 15.85% in FY15-16, imports too dropped by almost the same margin i.e. 15.28% for the same period.A decline of 15.85%. With the global economy still struggling to recover, demand from developed countries and China has been low. Low prices of oil have not helped raise international demand and the overall export demand continued to remain subdued. Trade Balance
Parameter |
Year 2013-14 |
Year 2014-15 |
Year 2015-16 |
| Trade Balance | negative $138.59 billion | negative $137.69 billion | negative $118.45 billion |
In keeping with the decline in export and imports, the overall trade balance saw a decline by $19.23 billion. Forex Reserves
Parameter |
Year 2013-14 |
Year 2014-15 |
Year 2015-16 |
| Forex Reserves | $ 298.64 billion | $339.9 billion | $355.5 billion |
Forex reserves continued to grow steadily from $298.64 billion in 2012-13 to cross $349.6 billion by January 2016. The low prices of crude oil in the international market have largely contributed to this. Exchange Rate
Parameter |
Year 2013-14 |
Year 2014-15 |
Year 2015-16 |
| Rupee Exchange Rate (US$) | 59.96 (31 Mar 2014) | 62.31 (31 Mar 2015) | 66.28 (31 Mar 2016) |
Currency Composition (percentage) of India’s external debt
| Currency | Year 2014-15 | Year 2015-16 |
| US$ | 58.3% | 57.6% |
| INR | 27.9% | 28.7% |
| SDR | 5.8% | 5.8% |
| Japanese Yen | 4% | 4.1% |
| Euro | 2.4% | 2.3% |
With the US$ strengthening against the Indian Rupee, the US$ share came down by 0.7%, while the INR actually saw an increase by 0.8%. The Japanese Yen share too increased by 0.1%, while Euro share came down by 0.1%. SDR maintained its share as in previous year. BSE SENSEX
Parameter |
Year 2013-14 |
Year 2014-15 |
Year 2015-16 |
| BSE SENSEX | 22467.21 (As on 31 Mar 2014) | 27957.49 (As on 31 Mar 2015) | 25341.86 (As on 31 Mar 2015) |
In the first year i.e. by 31 March 2015, the markets seemed to have upheld the confidence and it seemed that it would continue its north trajectory and this was reflected in the Sensex improving by 13.11% over the 26 May 2014 level and closing at 27,957.49 on 31 March 2015. However, the markets have been disappointed with the slow pace of reforms and lack of adequate capital circulating in the economy.The Narendra Modi-led NDA government was sworn-in on 26 May 2014 with a massive mandate that included widespread support from corporate India that placed great hopes on his government to rejuvenate a stagnating economy that India witnessed during the last stages of the UPA II regime. After two years since taking office, the markets are more or less at the same level as they were when the NDA government was sworn-in. This reflects the general mood of the markets which now seems to be more cautious and circumspect over the government having the political will to push for the much needed reforms, moves that will rejuvenate the economy and the markets. Industrial Growth
Parameter |
Year 2013-14 |
Year 2014-15 |
Year 2015-16 |
| Industrial Growth | 4.50% | 2.80% | 3.1%(April-Dec) |
After witnessing negative growth in 2013-14, 2014-15 under the Modi administration delivered an improved 2.8% growth in Index of Industrial Production (IIP) at Base 2004-5=100. The growth further improved to 3.1% for the period April 2015 and Dec 2015 and mainly reflected increased government spending and easier capital access. Inflation
Parameter |
Year 2013-14 |
Year 2014-15 |
Year 2015-16 |
| Inflation | CPI : 9.5%, WPI : 5.9% | CPI : 5.9%, WPI : 2.0% | CPI : 4.9% WPI : -2.8% |
In March 2016, CPI softened to 4.9% as compared to 5.7% in January 2016. RBI’s target for March 2017 is 5.0%. The WPI has continued to remain in the negative for the 17th consecutive month since November 2014. However, analysts believe that the WPI for FY 2016-17 will be around 1.2% and 2017-18 it could touch an average of 3.3%. Service Sector Growth
Parameter |
Year 2013-14 |
Year 2014-15 |
Year 2015-16 |
| Service Sector Growth | 6.80% | 10.30% | 9.2%(AE) |
In 2014-15, the service sector contributed $ 783 billion which represented around 52% of the GDP, growing at 9% CAGR. This was well ahead of the overall GDP CAGR of 6.2% witnessed in the previous four years. By 2020, the share is expected to touch 62% of the GDP. The services sector remains the most attractive for FDI in India. Foodgrain Production
Parameter |
Year 2013-14 |
Year 2014-15 |
Year 2015-16 |
| Foodgrain Production | 252.68 million tonnes | 252 million tonnes | 253.2 million tonnes (AE) |
Despite being a large direct and indirect employer, the agriculture sector has remained subdued on growth. This is primarily on account of poor consecutive monsoons. However, with IMD in India predicting above average rains in 2016, the agriculture and allied sectors is expected to deliver an improved performance this year. Petrol & Diesel Prices
Parameter |
Year 2013-14 |
Year 2014-15 |
Year 2015-16 |
| Petrol Price (Delhi) | Rs. 73.16 per litre (As on 31 Mar 2014) | Rs. 60.49 per litre (As on 31 Mar 2015) | Rs. 59.68 per litre (31 Mar 2016) |
| Diesel Price (Delhi) | Rs. 55.48 per litre (As on 31 Mar 2014) | Rs. 49.71 per litre (31 Mar 2015) | Rs. 48.33 per litre (31 Mar 2016) |
The drop in petrol price is attributed to the reduction in the price of crude oil in the international market. In fact, it slashed the price of crude oil for India from $106 per barrel (July 2014) to $26 (January 2016), which was a 75% drop over 15 months.
Explore More :
Schemes Launched by Modi Government
Sarva Shiksha Abhiyan
Education for all: Smriti Irani’s big challenge
10 Best Things Modi Government Has Done So Far
Schemes Launched by Modi Govt Start-up India, Stand-up India
Gram Uday Se Bharat Uday Abhiyan
‘Stand up India’ Scheme by PM Modi : Highlights, Objectives, Benefits, Process Pradhan
Mantri Ujwala Yojna Sukanya Samriddhi Account
Swachh Bharat Abhiyan: Making India Clean & More
Pradhan Mantri Jeevan Jyoti Bima Yojana (PMJJBY)
Pradhan Mantri Suraksha Bima Yojana (PMSBY)
Pradhan Mantri Kaushal Vikas Yojana
Pradhan Mantri Krishi Sinchai Yojana Pradhan Mantri Awas Yojana (PMAY)
One Rank One Pension Scheme
Seventh Pay Commission
All Information about Digital India Programme
eBasta – Features and Benefit for students
Atal Mission for Rejuvenation and Urban Transformation
Mahatma Gandhi National Rural Employment Guarantee Act (MGNREGA)
Beti Bachao Beti Padhao Scheme Skill India
BJP Theme Song on 2 Years of Modi Government
Pradhan Mantri Nai Manzil Scheme
Padhe Bharat Badhe Bharat Scheme


