
Observe the population growth curve and answer the questions given below:
(a) State the conditions under which growth curve ‘A’ and growth curve B’ plotted in the graph are possible.
(b) Mention what does K’ in the graph represent.
Ans.
(a)
-
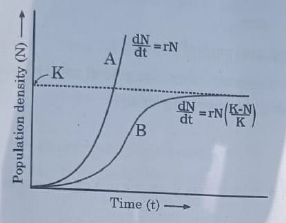
Growth curve 'A': Represents exponential growth with abundant resources, minimal competition, and ideal environmental conditions. Population grows rapidly.
-
Growth curve 'B': Represents logistic growth as population approaches carrying capacity (K). Initially exponential growth, but levels off as resources become limited and competition increases. Population stabilizes near K.
(b)
-
'K': Represents carrying capacity of environment, the maximum sustainable population size. Influenced by factors like food availability, habitat space, competition, predation, disease, etc. When population reaches K, growth slows and stabilizes.