| *Map showing state wise per capita income of India from 1999 to 2013. |
Disclaimer: All efforts have been made to make this image accurate. However Mapping Digiworld Pvt Ltd and its directors do not own any responsibility for the correctness or authenticity of the same. |
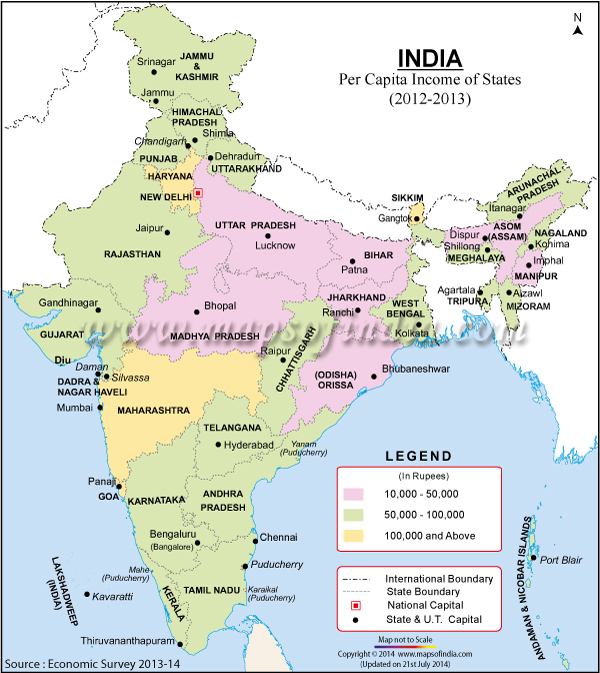
State Wise Per Capita Income of India 2012-13 |
|
 |
|
|
| *Map showing the per capita income of India 2012-13. |
Disclaimer: All efforts have been made to make this image accurate. However Mapping Digiworld Pvt Ltd and its directors do not own any responsibility for the correctness or authenticity of the same. |
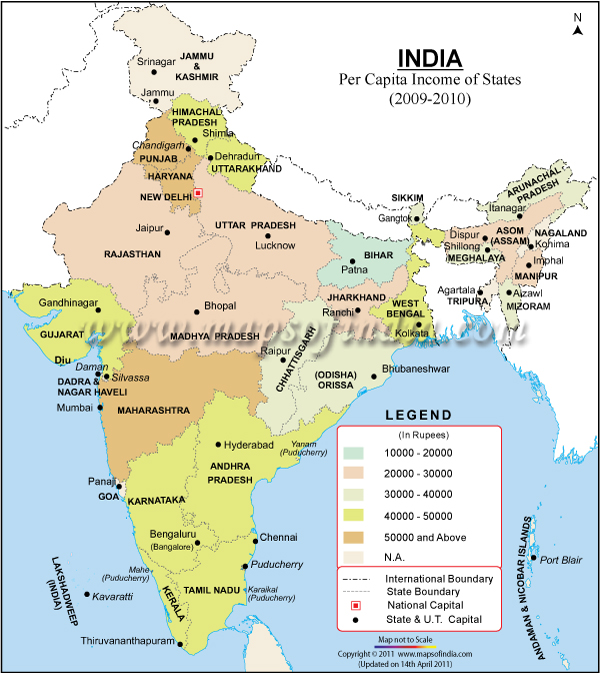
| State Wise Per Capita Income of India 2009-10 |
|
 |
|
|
| *Map showing the per capita income of India 2009-10. |
Disclaimer: All efforts have been made to make this image accurate. However Mapping Digiworld Pvt Ltd and its directors do not own any responsibility for the correctness or authenticity of the same. |
Per Capita Net State Domestic Product at Current Prices (2004-05 Series)
| Sl. No. | State\UT | 2004-05 | 2005-06 | 2006-07 | 2007-08 | 2008-09 | 2009-10 | 2010-11 | 2011-12 | 2012-13 | 2013-14 |
|---|
| 1 | Andhra Pradesh (undivided) | 25321 | 28539 | 33135 | 39727 | 46345 | 51114 | 62148 | 69742 | 78958 | 88876 |
| 2 | Arunachal Pradesh | 26721 | 28171 | 30132 | 34466 | 39726 | 51068 | 60935 | 68667 | 76218 | 84869 |
| 3 | Assam | 16782 | 18396 | 19737 | 21290 | 24099 | 28383 | 33087 | 36415 | 40475 | 46354 |
| 4 | Bihar | 7914 | 8223 | 9967 | 11051 | 13728 | 15457 | 19111 | 22582 | 27202 | 31229 |
| 5 | Chhattisgarh | 18559 | 20117 | 24800 | 29385 | 34360 | 34366 | 41165 | 48366 | 52983 | 58297 |
| 6 | Goa | 76968 | 84721 | 94882 | 108708 | 135966 | 149164 | 168024 | 211570 | 200514 | N.A. |
| 7 | Gujarat | 32021 | 37780 | 43395 | 50016 | 55068 | 64097 | 77485 | 87175 | 96976 | N.A. |
| 8 | Haryana | 37972 | 42309 | 49261 | 56917 | 67405 | 82037 | 93852 | 106358 | 119158 | 132089 |
| 9 | Himachal Pradesh | 33348 | 36949 | 40393 | 43966 | 49903 | 58402 | 68297 | 75185 | 83899 | 92300 |
| 10 | Jammu & Kashmir | 21734 | 23240 | 25059 | 27448 | 30212 | 33650 | 40089 | 46734 | 52250 | 58593 |
| 11 | Jharkhand | 18510 | 18326 | 19789 | 24789 | 25046 | 28223 | 34721 | 36554 | 40238 | 46131 |
| 12 | Karnataka | 26882 | 31239 | 35981 | 42419 | 48084 | 51364 | 62251 | 68053 | 76578 | 84709 |
| 13 | Kerala | 31871 | 36276 | 40419 | 45700 | 53046 | 60226 | 67652 | 78387 | 88527 | N.A. |
| 14 | Madhya Pradesh | 15442 | 16631 | 19028 | 20935 | 25278 | 28651 | 32453 | 37979 | 44989 | 54030 |
| 15 | Maharashtra | 36077 | 41965 | 49831 | 57760 | 62234 | 69765 | 84858 | 93748 | 103991 | 114392 |
| 16 | Manipur | 18640 | 20395 | 21423 | 23090 | 24764 | 27093 | 28931 | 34518 | 36937 | N.A. |
| 17 | Meghalaya | 24086 | 26284 | 30952 | 34229 | 40583 | 43142 | 49261 | 50316 | 52090 | 58522 |
| 18 | Mizoram | 24662 | 26698 | 28764 | 32488 | 38582 | 42715 | 50956 | 53624 | 63413 | N.A. |
| 19 | Nagaland | 30441 | 33792 | 36568 | 39985 | 46207 | 50263 | 55582 | 63781 | 70274 | 77529 |
| 20 | Odisha | 17650 | 18846 | 22237 | 27735 | 31416 | 33029 | 39537 | 41876 | 49241 | 54241 |
| 21 | Punjab | 33103 | 36199 | 41883 | 49380 | 55315 | 61805 | 69582 | 76895 | 84526 | 92638 |
| 22 | Rajasthan | 18565 | 20275 | 24055 | 26882 | 31279 | 35254 | 44644 | 52735 | 59097 | 65098 |
| 23 | Sikkim | 26690 | 30252 | 32199 | 36448 | 46983 | 90749 | 108972 | 130127 | 151395 | 176491 |
| 24 | Tamil Nadu | 30062 | 35243 | 42288 | 47606 | 54137 | 64338 | 78473 | 89050 | 98628 | 112664 |
| 25 | Tripura | 24394 | 26668 | 29081 | 31111 | 35587 | 39815 | 46050 | 54077 | 60963 | N.A. |
| 26 | Uttar Pradesh | 12950 | 14221 | 16013 | 17785 | 20422 | 23671 | 26698 | 30071 | 33616 | 37630 |
| 27 | Uttarakhand | 24726 | 29441 | 35111 | 42619 | 50657 | 62757 | 73819 | 85372 | 92191 | 103349 |
| 28 | West Bengal | 22649 | 24720 | 27823 | 31567 | 35487 | 41039 | 47245 | 53383 | 61352 | 69413 |
| 29 | Andaman & Nicobar Islands | 40921 | 44754 | 53778 | 61430 | 69177 | 78936 | 80558 | 89642 | 97687 | 107418 |
| 30 | Chandigarh | 74173 | 84993 | 97568 | 102980 | 108486 | 117371 | 126651 | 136883 | 141926 | 156951 |
| 31 | Delhi | 63877 | 72208 | 83275 | 95241 | 111756 | 125936 | 145129 | 166883 | 192587 | 219979 |
| 32 | Puducherry | 48302 | 67205 | 68673 | 74201 | 79306 | 96860 | 101072 | 103149 | 114034 | 148784 |
| All-India Per Capita NNI (2004-05base) | | 24143 | 27131 | 31206 | 35825 | 40775 | 46249 | 54021 | 61855 | 67839 | 74380 |
*Source For Sl. No. 1-32 - Directorate of Economics & Statistics of respective State Governments, and for All-India - Central Statistics Office
N.A: Not released as on August 01, 2014
Notes :
- Population as per the Provisional figures released by RGI for Census 2011 have been used by the States of Arunachal Pradesh, Himachal Pradesh, Manipur, Meghalaya, Nagaland, Odisha, Delhi and Puducherry
- Estimates for the years 2004-05 to 2012-13 have been discussed by CSO with the state DES
- State Estimates have not yet been compiled on 2011-12 base
Growth of Per Capita Net State Domestic Product at Current Prices (2004-05 Series) (Percentage change over previousyear)
| Sl. No. | State\UT | 2005-06 | 2006-07 | 2007-08 | 2008-09 | 2009-10 | 2010-11 | 2011-12 | 2012-13 | 2013-14 |
|---|
| | | 4 | 5 | 6 | 7 | 8 | 9 | 10 | 11 | 12 |
| 1 | Andhra Pradesh (undivided) | 12.7 | 16.1 | 19.9 | 16.7 | 10.3 | 21.6 | 12.2 | 13.2 | 12.6 |
| 2 | Arunachal Pradesh | 5.4 | 7 | 14.4 | 15.3 | 28.6 | 19.3 | 12.7 | 11 | 11.4 |
| 3 | Assam | 9.6 | 7.3 | 7.9 | 13.2 | 17.8 | 16.6 | 10.1 | 11.1 | 14.5 |
| 4 | Bihar | 3.9 | 21.2 | 10.9 | 24.2 | 12.6 | 23.6 | 18.2 | 20.5 | 14.8 |
| 5 | Chhattisgarh | 8.4 | 23.3 | 18.5 | 16.9 | 0 | 19.8 | 17.5 | 9.5 | 10 |
| 6 | Goa | 10.1 | 12 | 14.6 | 25.1 | 9.7 | 12.6 | 25.9 | -5.2 | N.A. |
| 7 | Gujarat | 18 | 14.9 | 15.3 | 10.1 | 16.4 | 20.9 | 12.5 | 11.2 | N.A. |
| 8 | Haryana | 11.4 | 16.4 | 15.5 | 18.4 | 21.7 | 14.4 | 13.3 | 12 | 10.9 |
| 9 | Himachal Pradesh | 10.8 | 9.3 | 8.8 | 13.5 | 17 | 16.9 | 10.1 | 11.6 | 10 |
| 10 | Jammu & Kashmir | 6.9 | 7.8 | 9.5 | 10.1 | 11.4 | 19.1 | 16.6 | 11.8 | 12.1 |
| 11 | Jharkhand | -1 | 8 | 25.3 | 1 | 12.7 | 23 | 5.3 | 10.1 | 14.6 |
| 12 | Karnataka | 16.2 | 15.2 | 17.9 | 13.4 | 6.8 | 21.2 | 9.3 | 12.5 | 10.6 |
| 13 | Kerala | 13.8 | 11.4 | 13.1 | 16.1 | 13.5 | 12.3 | 15.9 | 12.9 | N.A. |
| 14 | Madhya Pradesh | 7.7 | 14.4 | 10 | 20.7 | 13.3 | 13.3 | 17 | 18.5 | 20.1 |
| 15 | Maharashtra | 16.3 | 18.7 | 15.9 | 7.7 | 12.1 | 21.6 | 10.5 | 10.9 | 10 |
| 16 | Manipur | 9.4 | 5 | 7.8 | 7.2 | 9.4 | 6.8 | 19.3 | 7 | N.A. |
| 17 | Meghalaya | 9.1 | 17.8 | 10.6 | 18.6 | 6.3 | 14.2 | 2.1 | 3.5 | 12.3 |
| 18 | Mizoram | 8.3 | 7.7 | 12.9 | 18.8 | 10.7 | 19.3 | 5.2 | 18.3 | N.A. |
| 19 | Nagaland | 11 | 8.2 | 9.3 | 15.6 | 8.8 | 10.6 | 14.8 | 10.2 | 10.3 |
| 20 | Odisha | 6.8 | 18 | 24.7 | 13.3 | 5.1 | 19.7 | 5.9 | 17.6 | 10.2 |
| 21 | Punjab | 9.4 | 15.7 | 17.9 | 12 | 11.7 | 12.6 | 10.5 | 9.9 | 9.6 |
| 22 | Rajasthan | 9.2 | 18.6 | 11.8 | 16.4 | 12.7 | 26.6 | 18.1 | 12.1 | 10.2 |
| 23 | Sikkim | 13.3 | 6.4 | 13.2 | 28.9 | 93.2 | 20.1 | 19.4 | 16.3 | 16.6 |
| 24 | Tamil Nadu | 17.2 | 20 | 12.6 | 13.7 | 18.8 | 22 | 13.5 | 10.8 | 14.2 |
| 25 | Tripura | 9.3 | 9 | 7 | 14.4 | 11.9 | 15.7 | 17.4 | 12.7 | N.A. |
| 26 | Uttar Pradesh | 9.8 | 12.6 | 11.1 | 14.8 | 15.9 | 12.8 | 12.6 | 11.8 | 11.9 |
| 27 | Uttarakhand | 19.1 | 19.3 | 21.4 | 18.9 | 23.9 | 17.6 | 15.7 | 8 | 12.1 |
| 28 | West Bengal | 9.1 | 12.6 | 13.5 | 12.4 | 15.6 | 15.1 | 13 | 14.9 | 13.1 |
| 29 | Andaman & Nicobar Islands | 9.4 | 20.2 | 14.2 | 12.6 | 14.1 | 2.1 | 11.3 | 9 | |
| 30 | Chandigarh | 14.6 | 14.8 | 5.5 | 5.3 | 8.2 | 7.9 | 8.1 | 3.7 | 10.6 |
| 31 | Delhi | 13 | 15.3 | 14.4 | 17.3 | 12.7 | 15.2 | 15 | 15.4 | 14.2 |
| 32 | Puducherry | 39.1 | 2.2 | 8 | 6.9 | 22.1 | 4.3 | 2.1 | 10.6 | 30.5 |
| All-India Per Capita NNI(2004-05 base) | | 12.4 | 15 | 14.8 | 13.8 | 13.4 | 16.8 | 14.5 | 9.7 | 9 |
*Source : For Sl. No. 1-32 - Directorate of Economics & Statistics of respective State Governments, and for All-India - Central Statistics Office
N.A: Not released as on August 01, 2014
Notes :
- Population as per the Provisional figures released by RGI for Census 2011 have been used by the States of Arunachal Pradesh, Himachal Pradesh, Manipur, Meghalaya, Nagaland, Odisha, Delhi and Puducherry
- Estimates for the years 2004-05 to 2012-13 have been discussed by CSO with the state DES
- State Estimates have not yet been compiled on 2011-12 base
Per capita income is the amount of income being earned by a person in a certain region. In other words, it is defined as the mean income of people in an economic unit such as a city or a country. It can be calculated by taking measure of all sources of income in aggregate (like GDP) and dividing it by the total population. The per capita income is often calculated to measure standard of living in a country. This way it helps to locate the development status of the nations. However, critics claim that per capita income solely cannot accurately measure prosperity of a country.
inks Block start -->