|
|||||

| |||||
|
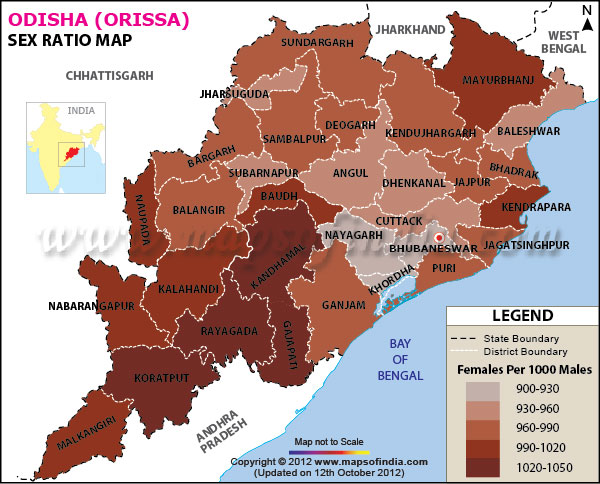
*The Map showing sex ratio in Odisha as per 2011 census of India. Map highlights the females per thousand males.
Disclaimer: All efforts have been made to make this image accurate. However Mapping Digiworld Pvt Ltd and its directors do not own any responsibility for the correctness or authencity of the same.
Disclaimer: All efforts have been made to make this image accurate. However Mapping Digiworld Pvt Ltd and its directors do not own any responsibility for the correctness or authencity of the same.
The Sex Ratio in Orissa is 978 for each 1000 male and has increased from 972 per 1000 males since the last census. The child sex ratio is 934 per 1000 males and has decreased as compared to 979 in the last census. Orissa has a Literacy rate of 73.45 percent, with male literacy at 82.40 percent and female literacy at 64.36 percent. In figures, the total literates in Orissa are 27,112,376 out of which the males are 15,326,036 and females are 11,786,340 respectively.
The following table provides district wise information of population, growth, sex ratio, literacy and density in Orissa.
| District | Population | Male population | Female population | Growth | Sex ratio | Literacy | Density |
|---|---|---|---|---|---|---|---|
| Anugul | 1271703 | 654898 | 616805 | 11.55 | 942 | 78.96 | 199 |
| Balangir | 1648574 | 831349 | 817225 | 23.29 | 983 | 65.5 | 251 |
| Baleshwar | 2317419 | 1184371 | 1133048 | 14.47 | 957 | 80.66 | 609 |
| Bargarh | 1478833 | 748332 | 730501 | 9.84 | 976 | 75.16 | 253 |
| Baudh | 439917 | 220993 | 218924 | 17.82 | 991 | 72.51 | 142 |
| Bhadrak | 1506522 | 760591 | 745931 | 12.95 | 981 | 83.25 | 601 |
| Cuttack | 2618708 | 1339153 | 1279555 | 11.86 | 955 | 84.2 | 666 |
| Debagarh | 312164 | 158017 | 154147 | 13.88 | 976 | 73.07 | 106 |
| Dhenkanal | 1192948 | 612597 | 580351 | 11.82 | 947 | 79.41 | 268 |
| Gajapati | 575880 | 282041 | 293839 | 10.99 | 1042 | 54.29 | 133 |
| Ganjam | 3520151 | 1777324 | 1742827 | 11.37 | 981 | 71.88 | 429 |
| Jagatsinghapur | 1136604 | 577699 | 558905 | 7.47 | 967 | 87.13 | 681 |
| Jajapur | 1826275 | 926058 | 900217 | 12.43 | 972 | 80.44 | 630 |
| Jharsuguda | 579499 | 297014 | 282485 | 13.69 | 951 | 78.36 | 274 |
| Kalahandi | 1573054 | 785179 | 787875 | 17.79 | 1003 | 60.22 | 199 |
| Kandhamal | 731952 | 359401 | 372551 | 12.92 | 1037 | 65.12 | 91 |
| Kendrapara | 1439891 | 717695 | 722196 | 10.59 | 1006 | 85.93 | 545 |
| Kendujhar | 1802777 | 907135 | 895642 | 15.42 | 987 | 69 | 217 |
| Khordha | 2246341 | 1166949 | 1079392 | 19.65 | 925 | 87.51 | 799 |
| Koraput | 1376934 | 677864 | 699070 | 16.63 | 1031 | 49.87 | 156 |
| Malkangiri | 612727 | 303913 | 308814 | 21.53 | 1016 | 49.49 | 106 |
| Mayurbhanj | 2513895 | 1253633 | 1260262 | 13.06 | 1005 | 63.98 | 241 |
| Nabarangapur | 1218762 | 604046 | 614716 | 18.81 | 1018 | 48.2 | 230 |
| Nayagarh | 962215 | 502194 | 460021 | 11.3 | 916 | 79.17 | 247 |
| Nuapada | 606490 | 300307 | 306183 | 14.28 | 1020 | 58.2 | 157 |
| Puri | 1697983 | 865209 | 832774 | 13 | 963 | 85.37 | 488 |
| Rayagada | 961959 | 469672 | 492287 | 15.74 | 1048 | 50.88 | 136 |
| Sambalpur | 1044410 | 529424 | 514986 | 11.63 | 973 | 76.91 | 158 |
| Subarnapur | 652107 | 332897 | 319210 | 20.35 | 959 | 74.42 | 279 |
| Sundargarh | 2080664 | 1055723 | 1024941 | 13.66 | 971 | 74.13 | 214 |
| District | Female per thousand male |
|---|---|
| NAYAGARH | 916 |
| KHORDHA | 925 |
| ANUGUL | 942 |
| DHENKANAL | 947 |
| JHARSUGUDA | 951 |
| CUTTACK | 955 |
| BALESHWAR | 957 |
| SUBARNAPUR | 959 |
| PURI | 963 |
| JAGATSINGHAPUR | 967 |
| SUNDARGARH | 971 |
| JAJAPUR | 972 |
| SAMBALPUR | 973 |
| BARGARH | 976 |
| DEBAGARH | 976 |
| BHADRAK | 981 |
| GANJAM | 981 |
| BALANGIR | 983 |
| KENDUJHAR | 987 |
| BAUDH | 991 |
| KALAHANDI | 1003 |
| MAYURBHANJ | 1005 |
| KENDRAPARA | 1006 |
| MALKANGIRI | 1016 |
| NABARANGAPUR | 1018 |
| NUAPADA | 1020 |
| KORAPUT | 1031 |
| KANDHAMAL | 1037 |
| GAJAPATI | 1042 |
| RAYAGADA | 1048 |
Last Updated on : 7/06/2013
